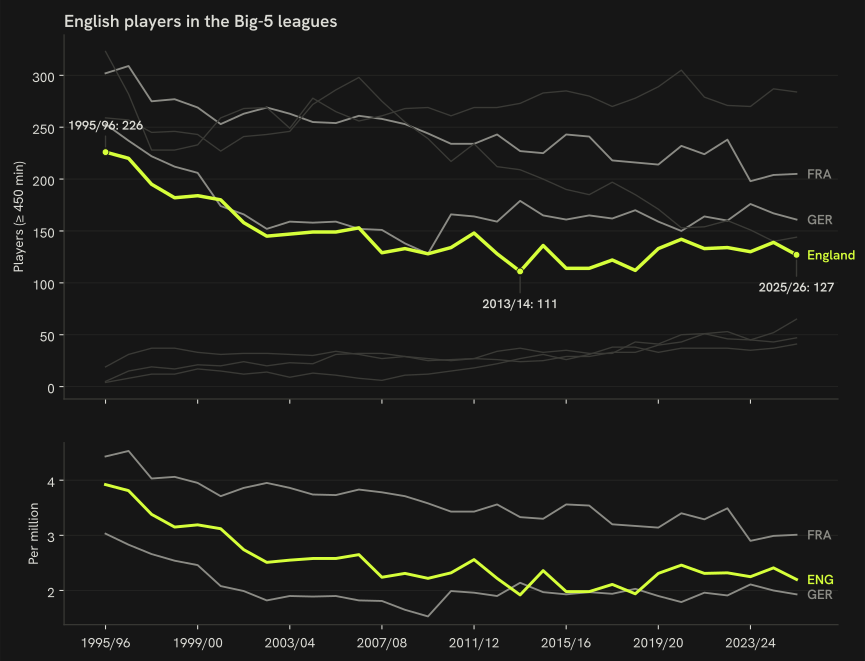
English players with 450+ minutes in the Big-5 leagues per season, 1995/96 to 2025/26
English players with ≥ 450 Big-5 minutes numbered 226 at the 1995/96 peak, 111 at the 2013/14 low and 128 in 2025/26; the model finds no step change (best candidate 2007/08, posterior 11 %, ×0.95).
How to read it: each line is one country’s count of players with at least 450 minutes in the five biggest leagues, season by season since 1995/96. English players are the green line; no season is marked: the model finds no step in the level more than 5 % from no change; the point past the last season is the forecast for next season with its 90 % interval. Toggle countries and switch to per million to compare fairly across sizes.
Change-point fit: max R-hat 1.003, minimum bulk ESS 2022, minimum tail ESS 2346, 0 divergent transitions, within the convergence rule fixed before the refit of 1 October 2026 (R-hat ≤ 1.01, bulk and tail ESS ≥ 400, no divergences).
How we know
As an analytics question In numbers: English players with ≥ 450 minutes in the Big-5 leagues each season since 1995/96, with each step in the level that a change-point model can date.
What we did We counted, season by season, how many home-nation players had real playing time in Europe's five biggest leagues, then asked a change-point model for the most probable seasons of a lasting rise and a lasting fall, with a probability on each.
Sources FBref Big-5 player tables 1995/96 → 2025/26; peers on the same rule. The names are, for each of the three seasons with the highest counts, the English players with the most Big-5 minutes that season, goalkeepers included, listed as a record of presence and not as a quality ranking: 1995/96: David Seaman, Alan Wright, Ian Walker; 1996/97: David James, Alan Wright, Ugo Ehiogu; 1997/98: Kevin Miller, Des Walker, Nigel Martyn. The dates come from a Bayesian local-level model with two ordered change points, one for the rise and one for the fall (Adams and MacKay, 2007); detail in § Methodology.
What this means
The model dates no step: its best candidate is 2007/08 (posterior 11 %; level ×0.95, 90 % HDI 0.77–1.20), within 5 % of no change. A break model describes the timing of a change in level; it identifies no cause. The forecast is the one registered item in the atlas and is scored only when the season’s tables are final.
What this does not show
Players in leagues outside the Big-5 (the top-9 count on the per-head page is wider), why the level changed, and any season beyond the one registered forecast.
Data snapshot: FBref tables fetched 14 September 2026, snapshot commit ef7dbd4 · code: src/big5_series.py, src/series_model.py · status: exploratory, not pre-registered · all limitations