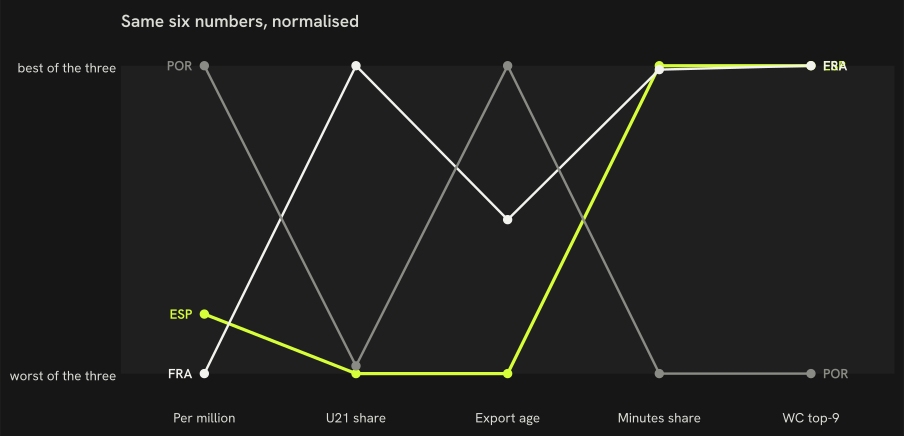
Spain, France and Portugal on seven pathway measures, 2025/26
On the same definitions, France gives its under-21 nationals 9 % of home-league minutes against 5 % in Spain, and 96 % of its tournament squad played in the 9 top-ranked leagues against 96 %.
How to read it: six measures, each rescaled so 0 is the worst of the three countries and 1 the best, one line per country. With only three countries the rescaling stretches any difference to the full height, including differences of a few tenths; read the raw values in the table.The seven numbers, unscaled
Metric
ESP
FRA
POR
Players per million
9.54
5.79
25.19
U21 share of domestic minutes
4.8 %
8.8 %
4.9 %
Age at first top-9 season (recent entrants)
21.5
21
20.5
Sideways moves
74 %
—
—
Exports' club-minutes share
36 %
36 %
29 %
National-team squad in the top-9 leagues
96 %
96 %
88 %
Big-5 players now
285
206
47
— : no value; for the squad row, the country did not play at the tournament.
How we know
As an analytics question In numbers: France and Portugal against Spain on the same seven pathway definitions, same seasons.
What we did We compared the home nation with the two comparison countries on seven numbers, each one defined and measured in exactly the same way for all three.
Sources Same definitions, same seasons; a comparison, not a causal claim. The chart rescales the first six measures 0–1 across the three countries, direction chosen so 1.0 is always the more open pathway (more players per million, more U21 minutes, an earlier age at the first top-9 season, fewer sideways moves, a bigger minutes share abroad, more of the squad in the top-9); the table keeps the raw numbers.
What this means
The table gives the seven measures side by side, measured the same way for the three countries, so a difference in the table is a difference in the data. With three countries no measure can be tied statistically to the per-head count, and the rescaled chart exaggerates small differences.
What this does not show
Why the three countries differ, how the measures move over time, and any country outside the three.
Data snapshot: FBref tables fetched 14 September 2026, snapshot commit ef7dbd4 · code: src/render.py (_build_peer_compare), src/pathways.py · status: exploratory, not pre-registered · all limitations