Summary · Question 1 of 14
Five pathway measures: Czechia, Norway and Denmark, 2025/26
Five measures, from youth minutes at home to players in Europe’s top-ranked leagues, for Czech football and the two comparison countries used throughout the atlas. Each links to the page with the full evidence. The order follows a player’s path; it is not a causal chain.
-
Playing time for under-21 nationals in the country’s own top league.
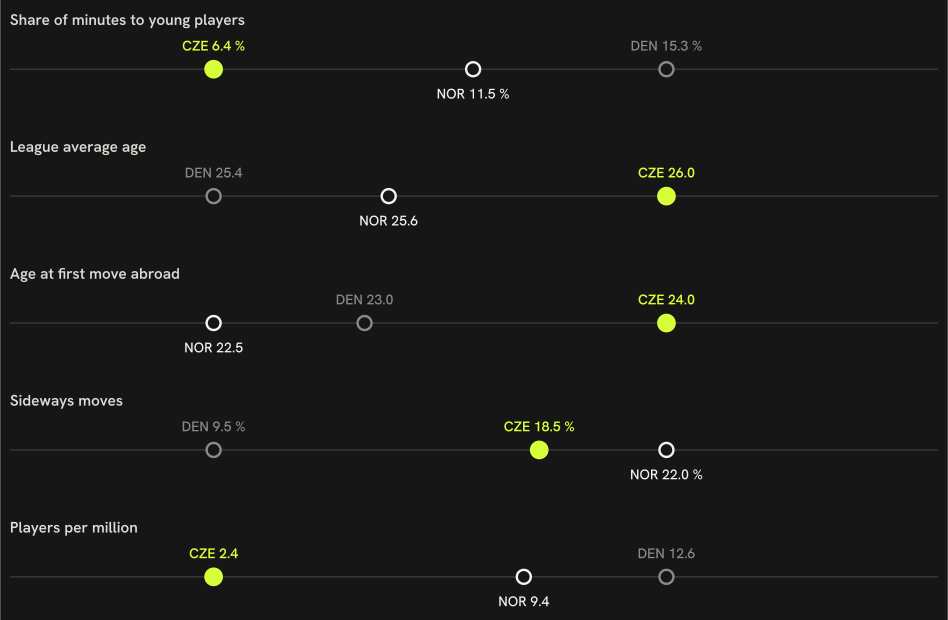
Share of league minutes that went to players aged 21 or under
CZE 6.4 % NOR 11.5 % DEN 15.3 %Clubs that gave those young players more than a tenth of their own playing time
CZE 9 of 16 clubs NOR 12 of 16 clubs DEN 11 of 12 clubsUnder-21 nationals who were regular starters, per club in the league
CZE 1.06 per club (17 players) NOR 1.56 per club (25 players) DEN 2.50 per club (30 players)The regular-starter line is drawn at ten starts; at five it is 1.5 per club, at fifteen 0.5 (ten: 1.1).
They are not used mainly as late substitutes: 6.0 % of the league’s starts went to them against 6.4 % of its minutes, and a starting under-21 was on the pitch for a median 76 minutes against the league’s 79.
-
The age profile of the home league.
Average age of a minute played in the league
CZE 26.0 NOR 25.6 DEN 25.4Share of league minutes that went to players aged 30 or over
CZE 21.1 % NOR 15.9 % DEN 19.5 % -
Age at the first season with real playing time in a foreign league.
Median age at the first season with real playing time in a foreign league, over the players abroad today
CZE 24 years (32 players) NOR 22.5 years (60 players) DEN 23 years (112 players) -
Moves abroad to a league no stronger than the home league.
Share of players abroad in a league no stronger than their own (UEFA-coefficient multiplier)
CZE 19 % NOR 22 % DEN 10 % -
Players in Europe’s top-ranked leagues per million people.
Players in Europe's top-ranked leagues, for every million people
CZE 2.39 NOR 9.37 DEN 12.58The change-point model’s most probable season for a fall in the count of Czech players in the Big-5 is 2014/15 (posterior 58 %), a level change of ×0.59 (90 % HDI 0.37–1.02). The 90 % interval for the fall includes ×1.00, so the fall is not distinguishable from no change at that level. Break & forecast.
In the gap decomposition (descriptive, see its page), the channel with the largest contribution is how strong the domestic league is for Norway and how much playing time young players get at home for Denmark. It describes associations across 8 countries and does not say what would change the gap.
Explore the data
Five pathway measures
Five pathway measures
Four exhibits comparing Czechia with 8 peer countries: youth exposure at home, export route, how exports fare, and who made it.
Exhibit A — youth exposure at home
Share of a domestic league's total minutes played by its own nationals aged 21 or under, 2025/26.
* Σ minutes of players with the league country's nationality and age ≤ 21 at the season's start ÷ Σ minutes of all players in the league, 2025/26. Under-23 shares: DEN 21.2 %, HUN 22.6 %, CRO 22.7 %, NOR 19.8 %, AUT 16.5 %, POL 14.4 %, SUI 16.6 %, CZE 13.5 %. A league without a bar is not covered by FBref.
Exhibit B — export route
For every peer-country player on a 2026/27 top-9 roster: the age at the first top-9 season (full roster, and recent entrants only) and, for recent entrants, the league of the season before it. Czech exports: 15 players, median export age 23 (recent entrants 7, median 22), 71 % of the recent ones straight from the Czech First League*.
| Country | n | Recent | Age at first top-9 season (all) | Age at first top-9 season (recent) | Domestic | Stepping stone | Other top-9 | Not covered | Censored |
|---|---|---|---|---|---|---|---|---|---|
| CZE Czechia | 15 | 7 | 23 | 22 | 71 % | 0 % | 0 % | 29 % | 20 % |
| SVK Slovakia | 11 | 4 | 24 | 23 | 0 % | 0 % | 0 % | 100 % | 27 % |
| AUT Austria | 37 | 13 | 23 | 22 | 54 % | 8 % | 0 % | 38 % | 35 % |
| HUN Hungary | 18 | 11 | 22 | 22 | 91 % | 0 % | 0 % | 9 % | 11 % |
| POL Poland | 30 | 13 | 23 | 24 | 38 % | 23 % | 0 % | 38 % | 20 % |
| CRO Croatia | 39 | 10 | 23 | 24.5 | 60 % | 10 % | 0 % | 30 % | 31 % |
| DEN Denmark | 65 | 25 | 22 | 22 | 60 % | 0 % | 0 % | 40 % | 14 % |
| SUI Switzerland | 42 | 13 | 23 | 21 | 85 % | 0 % | 0 % | 15 % | 33 % |
| NOR Norway | 37 | 17 | 21 | 22 | 53 % | 0 % | 0 % | 47 % | 19 % |
* Export age = age at the first season in any headline league, history back to 2020/21; a first appearance already in 2020/21 is censored. Recent entrants: first top-9 season 2025/26 or 2026/27, the only ones whose previous season lies inside the fetched window (2024/25 onwards for peer domestic leagues). Stepping-stone league: GER-2. Bundesliga, the one covered league below the top nine that is no peer’s home league. Not covered: no earlier row in the data.
Exhibit C — how the exports fare
Peer-country players at a top-9 club in 2025/26: median share of the club's minutes, and the club's strength within its league.
Median share of the club’s minutes
Median club goals-scored percentile within its league (club-strength proxy)
* Minutes share = player minutes ÷ (club matches × 90), 2025/26, one row per player-season. Club strength proxy: goals-scored percentile within league — clubs ranked by the goals their own roster scored that season (ClubElo was unreachable at run time). Both are medians over the country's exports; n per country in the bars.
Exhibit D — profile of those who made it
Goals + assists per 90, league-adjusted, in 2025/26 by the tier of the player's own league: domestic, stepping stone, top-9, or another covered league. Czech count and median against the median of the peer countries' values.
Profile table by tier and position group
| Tier | Group | CZE n | CZE median | Peer median n | Peer median |
|---|---|---|---|---|---|
| domestic league | FW | 27 | 0.21 | 17 | 0.13 |
| domestic league | MF | 89 | 0.08 | 61 | 0.07 |
| domestic league | DF | 49 | 0.03 | 45 | 0.03 |
| stepping-stone league | FW | 0 | — | 2 | 0.28 |
| stepping-stone league | MF | 0 | — | 2 | 0.09 |
| stepping-stone league | DF | 0 | — | 2 | 0.04 |
| top-9 league | FW | 5 | 0.27 | 5 | 0.29 |
| top-9 league | MF | 7 | 0.12 | 18.5 | 0.14 |
| top-9 league | DF | 7 | 0.03 | 9.5 | 0.04 |
| other covered league | FW | 1 | 0.12 | 6 | 0.13 |
| other covered league | MF | 6 | 0.08 | 6.5 | 0.08 |
| other covered league | DF | 3 | 0.01 | 5.5 | 0.02 |
* Tier = the league of the player's own 2025/26 season. Peer median n and peer median are medians across the peer countries present in that tier and group; a tier a country has no player in is absent, not zero.
Exhibit E — where Czech exports go
Of the 192 mapped Czech players, 27 play outside the Czech First League.
- top-9
Vladimír Coufal · Roman Květ · Ladislav Krejčí - peer country league
Patrik Hellebrand · Martin Chlumecký · Patrizio Stronati
* Buckets by the league of the player's own 2025/26 season; a player is counted once per position group, like everywhere else on the page, so one with rows in two groups counts in each; the number in front of each bar is the player count, the median multiplier is the bucket's median league multiplier. Sideways: destination league multiplier <= the domestic league's multiplier.
F · The 2026 FIFA World Cup squad by league tier
Where the 26 players named to the 2026 FIFA World Cup squad played in 2025/26, next to Switzerland, Croatia, Austria, Norway. Tier = the league of the player's most-minutes 2025/26 row.
Minutes, multipliers and age cohorts by country
| Country | Median minutes | Median multiplier | U22 | 23–25 | 26–29 | 30+ |
|---|---|---|---|---|---|---|
| CZE Czechia | 1826.5 | 0.434 | 1 | 6 | 10 | 9 |
| SUI Switzerland | 2132 | 0.788 | 1 | 5 | 10 | 10 |
| CRO Croatia | 1857 | 0.807 | 1 | 6 | 11 | 8 |
| AUT Austria | 1711.5 | 0.788 | 1 | 6 | 10 | 9 |
| NOR Norway | 2164.5 | 0.832 | 2 | 6 | 14 | 4 |
* 9 of the 130 squad players across the 5 countries have no 2025/26 row in the fetched leagues and are counted as unmatched (CZE 0, SUI 0, CRO 3, AUT 2, NOR 4).